Matthew Khouzam writes:
PyTorch includes built-in profiling capabilities that can export trace data as JSON files following the trace event standard. These traces can be loaded into Eclipse Trace Compass for powerful performance analysis.
Why Performance Optimization Matters Now
In January 2026, AI workloads are consuming unprecedented resources: approximately 70% of global DRAM production now goes to AI applications, and power consumption is outpacing power plant capacity. In this constrained environment, optimization isn’t optional, it’s a competitive advantage. Teams that can trace, analyze, and optimize their models efficiently will reach the market first.
What is Eclipse Trace Compass?
Eclipse Trace Compass is an open-source trace viewer and analyzer maintained by Ericsson. It excels at handling massive trace files (10GB+) with low memory consumption while remaining responsive. Unlike browser-based tools, Trace Compass can correlate PyTorch application traces with system-level traces from drivers and the OS, giving you a complete picture of your application’s performance.
Ericsson invested in Trace Compass because they needed a tool to troubleshoot complex communications systems. These systems cannot be “frozen” with breakpoints, doing so would disrupt live traffic and communications. Tracing provides a non-intrusive way to observe system behavior in production, making it the way forward for debugging and performance analysis in real-time systems.
As an open source project within the Eclipse Foundation, Trace Compass represents an investment in security. The Eclipse Foundation provides a safe technical space where research projects and industry partners can collaborate openly, ensuring the tool benefits from diverse contributions while maintaining security and governance standards.
Why Observability is Strategic
Observability isn’t just debugging, it’s a strategic technology that determines how fast you can iterate and how efficiently you use resources. Without visibility into your systems, you’re flying blind. You can’t optimize what you can’t measure, and you can’t fix what you can’t see.
In AI workloads, observability becomes even more critical. Training runs can take days or weeks, and discovering a performance bottleneck after the fact means wasted compute and delayed results. Real-time observability lets you catch issues early, understand resource utilization patterns, and make informed decisions about hardware investments.
Tracing provides the deepest level of observability, capturing not just what happened, but when, where, and why. It reveals causality and timing relationships that metrics and logs miss. For complex systems like AI pipelines, where operations span multiple layers from application code down to GPU kernels, tracing is the only way to see the complete picture. Organizations that invest in observability infrastructure move faster, spend less on compute, and ship better products.
Why Open Trace Formats Matter
Open trace formats ensure the full stack speaks the same language. When PyTorch, your GPU drivers, the Linux kernel, and your application code all export traces in the same standardized format, you can correlate events across every layer of your system. This is impossible with proprietary formats that lock you into vendor-specific tools.
The trace event format used by PyTorch and Trace Compass is an open standard. This means you can combine traces from multiple sources, application profiling, system calls, hardware events, and analyze them together. You see not just that your model is slow, but why: maybe a kernel scheduling issue, memory contention from another process, or inefficient GPU utilization.
Open formats also future-proof your observability investment. Your traces remain analyzable regardless of which tools or vendors you use tomorrow. This interoperability is essential for complex systems where no single tool can capture everything.
Basic Example
Here’s a minimal example that profiles a simple neural network:
import torch
import torch.nn as nn
import torch.optim as optim
import torch.profiler
class SimpleModel(nn.Module):
def __init__(self):
super(SimpleModel, self).__init__()
self.fc1 = nn.Linear(10, 50)
self.relu = nn.ReLU()
self.fc2 = nn.Linear(50, 1)
def forward(self, x):
return self.fc2(self.relu(self.fc1(x)))
model = SimpleModel()
optimizer = optim.SGD(model.parameters(), lr=0.01)
data = torch.randn(64, 10)
target = torch.randn(64, 1)
with torch.profiler.profile(
activities=[
torch.profiler.ProfilerActivity.CPU,
torch.profiler.ProfilerActivity.CUDA
],
record_shapes=True,
profile_memory=True,
with_stack=True
) as prof:
for step in range(5):
optimizer.zero_grad()
output = model(data)
loss = torch.nn.functional.mse_loss(output, target)
loss.backward()
optimizer.step()
prof.step()
prof.export_chrome_trace("trace.json")
print("Trace saved to trace.json")
For a more realistic example, see the YOLO people detection demo which profiles a pre-trained model performing inference on images.
Key Features
The PyTorch profiler provides several configuration options that control what data gets captured. Understanding these options helps you balance trace detail against file size and overhead:
- ProfilerActivity.CPU and ProfilerActivity.CUDA capture both CPU and GPU events
- record_shapes=True logs tensor shapes for each operation
- profile_memory=True tracks memory allocation and usage
- with_stack=True records call stacks for deeper analysis
- export_chrome_trace() outputs JSON in the trace event format
Why Trace Compass for PyTorch?
For production workloads or long training runs, PyTorch traces can easily exceed 10GB. Browser-based tools struggle with files this large, but Trace Compass is designed specifically for this scale. Additionally, when you need to understand interactions between your PyTorch code and the underlying system (GPU drivers, kernel scheduling, memory allocation), Trace Compass can import and correlate multiple trace sources simultaneously.
OS-level tracing also reveals resource contention from other processes, helping you identify when background services or competing workloads are impacting your model’s performance.
Advanced Usage
For long training runs, you can use schedule in the profiler to control when traces are recorded, preventing massive trace files. You can also use tensorboard_trace_handler to automatically save traces per training step.
The trace event format is standardized, meaning these traces work seamlessly with Eclipse Trace Compass and other compatible trace analysis tools.
Complete Demo: People Detection with YOLO
Let’s walk through a real-world example that demonstrates the full power of PyTorch profiling with Trace Compass. We’ll use a YOLOv8 model to detect people in a group photo and analyze the performance characteristics.
The Input
For this demo, an image from Friends Season One was selected.
Input Image

Detection result

The model successfully detected all 6 people in the image with high confidence.
Running the Demo
The people_detection.py script uses the Ultralytics YOLO implementation to perform person detection while capturing a detailed trace:
import torch
import torch.profiler
from ultralytics import YOLO
def detect_people(image_path, model_name="yolov8n.pt"):
model = YOLO(model_name)
with torch.profiler.profile(
activities=[
torch.profiler.ProfilerActivity.CPU,
torch.profiler.ProfilerActivity.CUDA
],
record_shapes=True,
profile_memory=True,
with_stack=True
) as prof:
results = model(image_path, classes=[0])
prof.export_chrome_trace("people_detection_trace.json")
return results
Run it with:
python pytorch-demo/people_detection.py pytorch-demo/friends.jpg
This generates people_detection_trace.json, which we can now analyze in Trace Compass.
Viewing the Results in Trace Compass
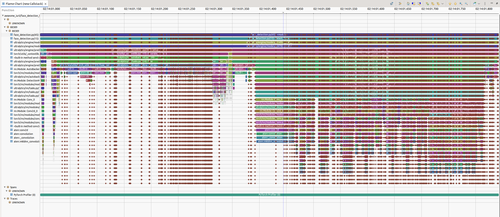
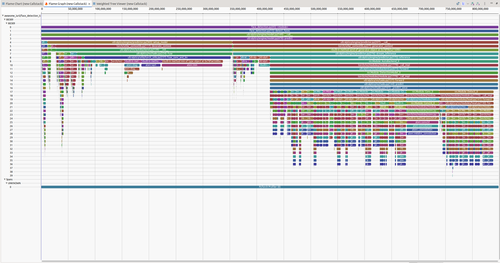
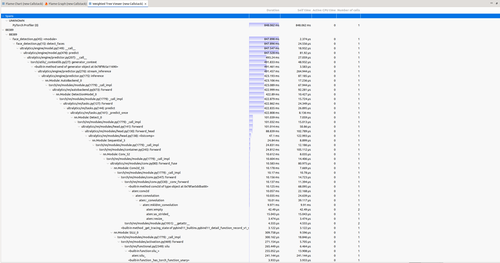
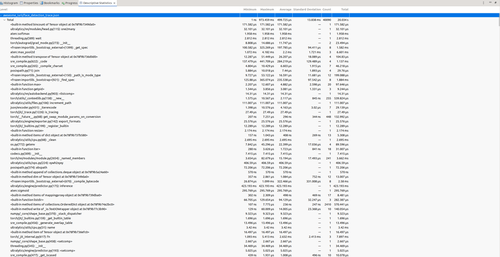
To load the trace, open Eclipse Trace Compass and import the JSON file via File → Open Trace. Once loaded, you get multiple complementary views that help you understand your model’s performance characteristics:
- Handles large traces: Trace Compass efficiently processes 10GB+ trace files with minimal memory usage
- System correlation: Correlate PyTorch operations with OS and driver-level events for complete performance visibility
- Rich visualizations: Interactive flame graphs, execution timelines, and comparison views
- Responsive UI: Remains snappy even with massive datasets
Analyzing the Results
The trace reveals where time is spent during inference through multiple complementary views:
Flame Chart - Shows the sequence of activities at a detailed level, revealing the temporal ordering of operations. You can see exactly when each layer executes, how operations overlap, and where synchronization points occur.

Flame Graph - Provides the bird’s eye view by aggregating time spent in each function across the entire trace. This quickly identifies the hottest code paths, the functions consuming the most time.

Weighted Statistics - The textual version of performance data, showing precise timing measurements for each operation. This is essential for quantitative analysis and comparing different runs.

Descriptive Statistics - Offers statistical summaries including mean, median, standard deviation, and percentiles for operation durations. This helps identify performance variability and outliers.

The Power of Multi-Layer Correlation
Together, these views show exactly where time is spent during the people detection processing. But the real power comes when you combine application traces with system-level traces. If we had captured a system trace alongside the PyTorch trace, we would see power consumption over time at the OS level. Correlating the two traces would reveal the total power draw per function for this AI/ML workload, connecting high-level model operations directly to their energy cost.
This multi-layer correlation is what makes Trace Compass invaluable for production AI systems. You’re not just optimizing code, you’re optimizing the entire stack from application logic down to hardware utilization and power consumption.
In future posts, we’ll explore capturing full kernel traces alongside PyTorch profiling, correlating power consumption data with model operations, and diving deep into performance insights to identify optimization opportunities.
Want to Get Involved?
Want to try it out? Visit tracecompass.org to download Eclipse Trace Compass and explore the documentation. The project welcomes contributions and collaboration, join the community to help shape the future of trace analysis.
Open source isn’t just a development model, it’s the standard for security and safety. When your infrastructure depends on tools you can audit, verify, and control, you’re building on a foundation you can trust. Eclipse Trace Compass exemplifies this: transparent, collaborative, and built to last. In a world where AI workloads are mission-critical, choosing open source tools isn’t idealism, it’s pragmatism.
My name is Matthew Khouzam, and I have the privilege of being paid by Ericsson to make the world a better place through open source, and for that I am grateful.