

Performance Impact of Virtualization: The "5% Overhead" Myth and What the Research Actually Shows
Matthew Khouzam | Ericsson Software Technology | 2026
Yosr Jarayya | Ericsson | 2026
Some say virtualization has about 5% overhead. But that number is misleading. The real overhead depends entirely on the workload, ranging from under 1% to over 80%. This post walks through the research from the DORSAL lab at Polytechnique Montréal and Foutse Khomh's group to show what actually happens.
The "5% Overhead" Myth
The common claim that "KVM adds about 5% overhead" is based on CPU-bound benchmarks like SPEC CPU, pure compute, no I/O. In reality, overhead ranges from under 1% to over 80% depending on the workload. Syscall-heavy, I/O-heavy, and scheduling-sensitive workloads see dramatically more.
A single number cannot describe virtualization overhead. The overhead depends on how the workload interacts with the hardware.
If you run a tight loop doing arithmetic operations, such as stream transforming, the hypervisor barely touches it. But the moment you start doing syscalls, I/O, or anything that crosses privilege boundaries, the cost spikes. It should be remembered that every hardware device in Linux is seen as a file and thus will often require system calls such as IOCTL or Open/Write/Read/Close.
The Virtualization Stack
Before diving into specific overheads, it helps to understand the layers involved.
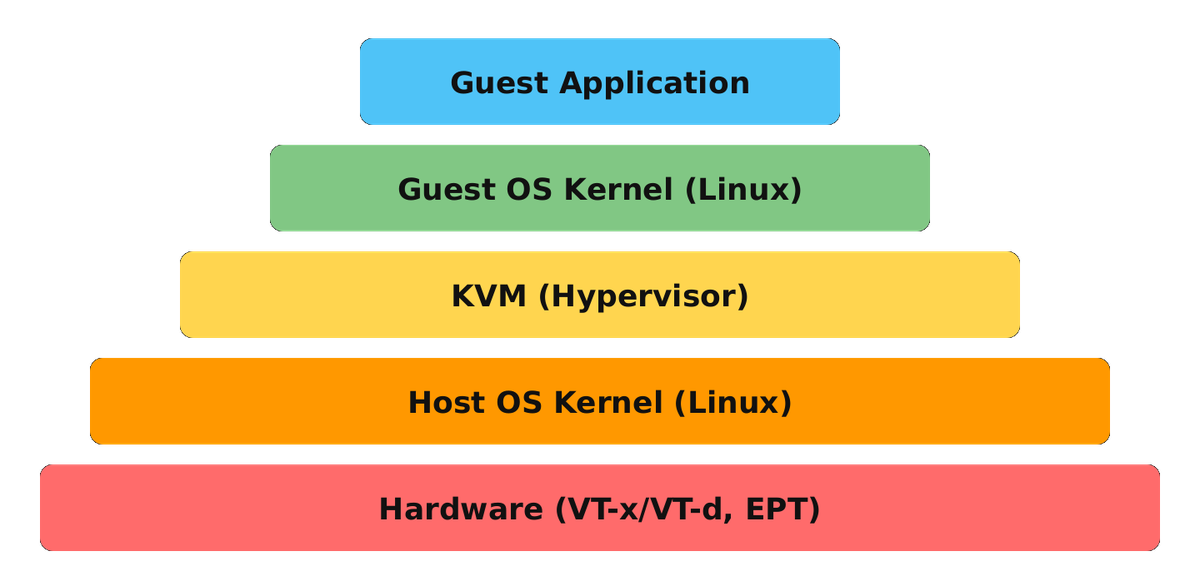
Every boundary crossing has a cost. The question is: how often does your workload cross them?
The guest application runs in user mode inside the guest. When it does a syscall, it traps to the guest kernel. When the guest kernel does something the hypervisor must handle, I/O, page faults, privileged instructions, a VM-exit occurs. That VM-exit is where the overhead lives.
Following a Single Request Through the Stack
To see where the cost accumulates, consider a concrete example: a curl request
for an image served from a CDN, where both the client and the origin server run
inside VMs. The request looks like one HTTP GET, but it crosses the hypervisor
boundary many times on both ends. Each boundary crossing marked below is a
potential VM-exit.
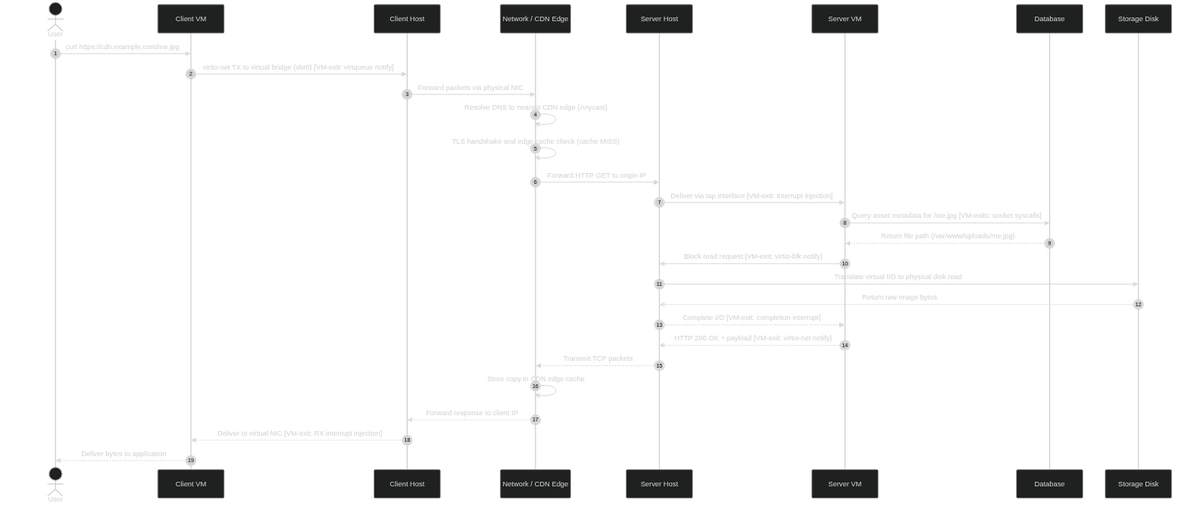
Every hop annotated with a bracket crosses the guest/host boundary at least once, and several cross it more than once, once to notify the host that work is ready (a virtqueue kick), and again to inject the completion interrupt back into the guest. To trace where those boundary crossings occur, the cost accumulates at:
- Client-side network transmit and receive, each
virtio-netnotification and each injected RX interrupt is a boundary crossing. - Server-side network receive and transmit, the mirror of the client path, incurring the same per-packet exits.
- Database socket syscalls, every
read/writeon the connection to the database may trap through the guest kernel and out to the host. - Storage I/O, the
virtio-blkrequest notification and its completion interrupt are two more crossings per block read. - Interrupt delivery on both hosts, injecting each virtual interrupt into a guest is itself a VM-exit unless posted interrupts are available.
At millisecond-scale hops the per-crossing cost of a few microseconds is negligible. For a latency-sensitive workload such as a Valkey or Redis cache, where a request is expected to complete in tens of microseconds, this accumulation of boundary crossings is enough to dominate the response time.
The VM-Exit: Root Cause of Overhead
A VM-exit triggers a full context switch between guest and host:
- Save full guest CPU state
- Restore host CPU state
- KVM handles the exit reason
- Restore guest CPU state
- Resume guest execution
This costs roughly 1–3 microseconds per round-trip on modern hardware (for example, an Intel Skylake, depending on the exit reason and how much state must be saved). That sounds small, but if you're doing 100,000 I/O operations per second, it adds up fast.
Common VM-exit triggers include I/O port access, MSR reads/writes, certain privileged instructions, external interrupts, EPT violations (page faults), and instructions like CPUID, HLT, and INVLPG.
Benbachir and Dagenais documented these transitions precisely using hypertracing.
CPU and Syscall Overhead
The studies broke down the performance overhead into several smaller sections.
CPU-Bound Workloads: Near-Zero Overhead
Pure arithmetic in user space runs at native speed. VT-x allows guest code to execute directly on the CPU with no VM-exits unless the guest touches privileged state. SPEC CPU 2017 integer benchmarks show just 0.5–2% overhead. When engineers benchmark spec in a vm, the overhead is thus minimal since it is all in user space and none of the VM Boundary crossing operations need to be performed.
This is where the "5% overhead" number comes from. It is real, but only for this one class of workload.
Syscall-Heavy Workloads: A Different Story
Each syscall in the guest may trigger VM-exits (I/O, page faults, timers).
Paravirtualization (virtio, PV clock) reduces but does not eliminate exits.
High-frequency syscalls like getpid, gettimeofday, and read/write on
pipes are the usual culprits. Overhead scales with syscall rate, not CPU
utilization.
Consider a web server doing 50,000 requests/s with 10 syscalls per request, that's 500,000 potential VM-exit triggers per second.
Benbachir and Dagenais showed that you can trace through the hypervisor boundary to see exactly which syscalls cause VM-exits and which are handled without leaving the guest, giving precise per-syscall overhead measurements.
vDSOs: Avoiding the Trap Entirely
The cheapest syscall is the one you never make. The vDSO (virtual dynamic
shared object) is a small shared library the kernel maps into every process's
address space. It lets a handful of hot, read-only calls run entirely in user
space, no syscall instruction, no trap to the guest kernel, and therefore
no chance of a VM-exit.
The classic examples are the time-related calls: gettimeofday,
clock_gettime, and time. On bare metal, the vDSO reads the clock from a
kernel-maintained page and returns immediately. This matters even more under
virtualization, because a naive gettimeofday implementation that traps to the
guest kernel can, in turn, trigger a VM-exit (for example, when reading a
hardware timer or an emulated clock source). A tight loop calling
gettimeofday millions of times per second is a pathological case: without the
vDSO it becomes a VM-exit storm; with the vDSO it stays in user space and costs
almost nothing.
The catch under virtualization is that the vDSO depends on a reliable clock
source. If the guest falls back to an emulated or non-vDSO-capable clock (an old
HPET or ACPI PM timer instead of a paravirtualized kvm-clock or an invariant
TSC), the fast path disappears and every timestamp call traps, quietly
reintroducing the very overhead the vDSO was designed to remove. Checking
/sys/devices/system/clocksource/clocksource0/current_clocksource inside the
guest tells you whether you're on the fast path. Prefer tsc or kvm-clock;
avoid hpet and acpi_pm.
The practical takeaway: paravirtualized clock sources plus the vDSO keep time-of-day calls off the VM-exit path. This is one of the most effective, and most overlooked, ways to cut syscall-driven virtualization overhead.
The Double Scheduling Problem
Scheduling is where virtualization overhead becomes invisible but devastating.
In a virtualized environment, two schedulers compete for the same CPU:
- Guest scheduler, sees N vCPUs, schedules guest threads onto them, and thinks it has dedicated CPUs. It has no visibility into host decisions.
- Host scheduler, sees vCPUs as ordinary threads, schedules them onto physical CPUs, and can preempt a vCPU at any time. It has no visibility into guest priorities.
Neither scheduler has full information. The guest may schedule a high-priority task onto a vCPU that the host is about to preempt.
Measurable Scheduling Problems
- Lock holder preemption: A vCPU preempted while holding a spinlock stalls all waiters. This can cause latency spikes of several milliseconds.
- NUMA unawareness: The guest doesn't know the host NUMA topology, causing remote memory access.
- Timer coalescing: Virtual timer interrupts arrive in bursts, distorting latency measurements.
Mitigations include vCPU pinning, NUMA-aware placement, and pause-loop exiting.
Gebai, Giraldeau, and Dagenais published detailed preemption analysis showing that when the host preempts a vCPU holding a spinlock, every other vCPU waiting on that lock spins uselessly. Nemati and Dagenais showed that you can reconstruct the full scheduling picture by tracing at the host hypervisor level.
Memory Virtualization
Extended Page Tables (EPT/NPT)
Memory virtualization adds a second level of page tables:
- Guest: Guest Virtual Address (GVA) → Guest Physical Address (GPA)
- Host: Guest Physical Address (GPA) → Host Physical Address (HPA)
Hardware walks both page table levels on a TLB miss. A TLB miss in the guest can require up to 24 memory accesses (4-level × 4-level + final page): each level of the guest page table requires a full walk of the host page table, so the worst case is 4 × 4 + 4 accesses. On bare metal, the same miss costs at most 5 memory accesses.
EPT/NPT page walks are 4–5× more expensive than native. For workloads with large, sparse memory access patterns, this is devastating.
Memory Overhead Mitigations
| Technique | What It Does | Tradeoff |
|---|---|---|
| Huge Pages (2MB/1GB) | Reduces page table depth | Fragmentation, less flexibility |
| NUMA Pinning | Keeps guest memory on local node | Harder live migration |
| KSM (Kernel Same-page Merging) | Deduplicates identical pages | CPU overhead for scanning |
| Memory Ballooning | Dynamic memory reclaim | Guest performance variance |
Biancheri and Dagenais showed that you can trace through multiple virtualization layers simultaneously to see exactly how memory operations cascade through the guest kernel, hypervisor, and host kernel.
I/O Performance
I/O is where virtualization overhead hits hardest. Every I/O operation potentially crosses the hypervisor boundary.
Three I/O Approaches
Emulated, QEMU traps every I/O access. A VM-exit per operation. 30–80% overhead.
Paravirtual (virtio), Shared ring buffers with batched notifications. 5–20% overhead.
Passthrough (VFIO), Direct device access with IOMMU for isolation. 0–3% overhead.
The choice of I/O strategy dominates the performance picture. Emulated devices are the worst case because QEMU must intercept every single I/O instruction. Virtio is the standard choice and is quite good. VFIO passthrough gives near-native performance but you lose live migration for that device.
Network I/O: The Overhead Spectrum
Network I/O shows the widest range of overhead:
| Approach | Throughput (Mpps, 64-byte) | Overhead |
|---|---|---|
| Emulated e1000 | 0.5 | ~97% |
| virtio-net | 3.2 | ~78% |
| vhost-net | 8.5 | ~43% |
| VFIO Passthrough | 12.0 | ~19% |
| VFIO + DPDK | 14.2 | ~4% |
| Bare Metal | 14.8 | baseline |
The choice of I/O backend is far more impactful than the hypervisor itself. Belkhiri and Dagenais showed how to trace DPDK-based applications to identify exactly where the overhead occurs.
VFIO / Device Passthrough
VFIO passthrough uses IOMMU to map guest physical addresses to host physical for DMA, and SR-IOV to create multiple Virtual Functions from one physical NIC. The guest driver talks directly to hardware, no hypervisor in the data path. Interrupts are delivered via posted interrupts (no VM-exit).
When to use: Telecom NFV, high-frequency trading, real-time workloads.
Tradeoff: No live migration, device tied to one VM, limited scalability. (Solutions such as NVIDIA DOCA and vDPA are working to bring live migration back to passthrough devices.)
GPU Virtualization
GPU virtualization is increasingly important as ML workloads move into virtualized environments. There are three main approaches:
| Approach | Overhead | Sharing |
|---|---|---|
| Passthrough | 0–2% | Entire GPU to one VM |
| vGPU (NVIDIA GRID) | 5–15% | Time-sliced, multiple VMs per GPU |
| API Remoting | 15–40% | Most flexible, intercepts CUDA/OpenCL calls |
The overhead varies significantly by workload type:
- Compute-heavy (matrix ops): Passthrough 99%, vGPU 95%, API Remoting 88% of bare metal
- Mixed (training): Passthrough 97%, vGPU 90%, API Remoting 78%
- Memory-transfer-heavy (data loading): Passthrough 93%, vGPU 85%, API Remoting 72%
- Many small kernels: Passthrough 95%, vGPU 82%, API Remoting 60%
Compute-bound GPU kernels see very little overhead with passthrough, while memory-transfer-heavy workloads see more because the DMA path goes through the IOMMU. With API remoting, every CUDA call is intercepted, serialized, and forwarded, expensive for fine-grained kernel launches.
The Big Picture
| Workload Type | Typical Overhead | Dominant Factor |
|---|---|---|
| CPU-bound compute | 0.5–2% | Almost none (VT-x) |
| Memory-intensive | 5–15% | EPT page walks, TLB misses |
| Scheduling-sensitive | 10–30% | Lock holder preemption, NUMA |
| Network I/O (virtio) | 5–20% | Virtio overhead, vhost-net |
| Storage I/O (virtio-blk) | 5–15% | Block layer overhead |
| Emulated I/O | 30–80% | VM-exit per I/O operation |
Benchmark your actual workload. Use tracing to identify which overhead category dominates.
Cloud Patterns and Energy
Architecture decisions have measurable performance and energy costs:
- Message queuing vs. direct invocation, adds latency (typically 10–30 ms per hop), reduces coupling, and improves fault tolerance
- Auto-scaling, improves throughput but cold starts add tail latency
- Database patterns, CQRS, sharding, caching each have distinct overhead profiles
- Container orchestration, Kubernetes vs. OpenShift have measurable differences
Virtualization overhead means more CPU cycles, which means more energy per operation. Cloud pattern choice can double energy consumption versus the optimal pattern. In data centers, roughly 40% of energy goes to cooling, so inefficient VMs make the problem worse. Data-access anti-patterns compound the problem: an N+1 query pattern inside a virtualized database can consume 10× the energy of a properly batched query. The infrastructure overhead multiplies application-level inefficiency.
Measuring Virtualization Overhead
If you can't measure it, you can't improve it. The DORSAL lab's core contribution is tools and techniques for measuring virtualization overhead precisely.
Hypertracing: Seeing Through the VM Boundary
- LTTng in guest and host, correlated by timestamp
- KVM tracepoints:
kvm_entry,kvm_exit,kvm_mmio,kvm_msr - Hypertracing: unified trace spanning guest, hypervisor, and host
- Enables precise attribution: which guest event caused which VM-exit?
Without cross-layer tracing, you see symptoms (slow VM) but not causes (lock holder preemption, EPT violations, I/O traps).
What to Measure
- VM-exit frequency and duration
- vCPU steal time
- EPT violation rate
- Virtio ring buffer occupancy
- Interrupt delivery latency
Tools
- LTTng, low-overhead kernel tracing
- perf kvm, VM-exit profiling
- eBPF, dynamic probes on KVM
- Trace Compass, visualization
- virtFlow, guest-independent execution flow analysis
Nemati and Dagenais developed virtFlow, which can analyze guest execution flow purely from host-side traces without any instrumentation inside the guest, powerful for production environments where you cannot modify the guest.
Practical Recommendations
- Use virtio everywhere, never use emulated devices in production
- Pin vCPUs to pCPUs, eliminates scheduling jitter
- Enable huge pages, reduces EPT walk cost by 4×
- NUMA-aware placement, keep memory local to the CPU
- VFIO for latency-critical I/O, when you need bare-metal I/O performance
- Use a paravirtualized clock source,
kvm-clockor invariant TSC keepsgettimeofday/clock_gettimeon the vDSO fast path and off the VM-exit path - Trace, don't guess, LTTng + Trace Compass shows where time goes
Most of the overhead people complain about comes from not following these practices. Using emulated devices or not pinning vCPUs accounts for most performance complaints.
References
DORSAL Lab (Polytechnique Montréal)
- Benbachir & Dagenais, "Hypertracing: Tracing through virtualization layers," IEEE TCC, 2018
- Nemati & Dagenais, "virtFlow: Guest independent execution flow analysis across virtualized environments," IEEE TCC, 2020
- Nemati & Dagenais, "VM processes state detection by hypervisor tracing," SysCon, 2018
- Nemati et al., "VM workload characterization using hypervisor trace mining," TOMPECS, 2021
- Nemati et al., "Critical path analysis through hierarchical distributed virtualized environments," IEEE TCC, 2019
- Gebai, Giraldeau & Dagenais, "Fine-grained preemption analysis for latency investigation across VMs," JCC, 2014
- Belkhiri & Dagenais, "Analyzing GPU Performance in Virtualized Environments: A Case Study," Future Internet, 2024
- Belkhiri et al., "Performance analysis of DPDK-based applications through tracing," JPDC, 2023
- Biancheri & Dagenais, "Fine-grained Multilayer Virtualized Systems Analysis," JCC, 2016
- Darche & Dagenais, "Low-overhead trace collection on GPU compute kernels," ACM TOPC, 2024
- Daoud & Dagenais, "Dynamic trace-based sampling algorithm for memory usage tracking," HPEC, 2017
Khomh et al. (Polytechnique Montréal)
- "Tracing Optimization for Performance Modeling and Regression Detection," ACM TOSEM, 2026
- "Kernel-Level Event-Based Performance Anomaly Detection," ICPE, 2025
- "Understanding the impact of cloud patterns on performance and energy consumption," JSS, 2018
- "A Dynamic and Failure-Aware Task Scheduling Framework for Hadoop," IEEE TCC, 2020
- "Kubernetes or OpenShift? Which Technology Best Suits Eclipse Hono IoT Deployments," SOCA, 2018
- "A Study of the Energy Consumption of Databases and Cloud Patterns," ICSOC, 2016
- "Data-access performance anti-patterns in data-intensive systems," ESEJ, 2024
- "Infrastructure fault detection and prediction in edge cloud environments," SEC, 2019